Top 500 revisited
After reclaiming my wordpress account, I looked at some old postings.
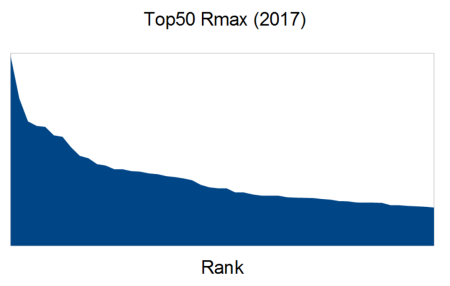
The Top500 list from 2009 shows four main groups of high-performance computers (HPC). These are clearly seen in the four levels that are substantially different from the next level. Here in 2017 the same four groups can be seen, but there are differences.
The top group is much faster (three to six times) than the second group. The next two groups are similarly much faster (although this is a log-scale graph, you can still see the groupings). The scale factor of course varies from 8 years ago.
The current political/technological emphasis is on China vs USA, although Switzerland has snuck into third place with a Cray. The lower rankings are filled with a mix of European, USA and Japanese machines. I suspect these machines consist of newer technologies that are delivered on the basis of “proven technology” while the leaders in the top 10 have invested in “proving a technology”.
The median machine has 148,000 cores, 6200 Tflop max, 10,000 Tflop peak, and 1.4MW power consumption. This is about 10x the median cores of 8 years ago. One conclusion is that manufacturers have greatly increased their integration skills and presumably the overall system reliability in this time.
What we don’t know: total RAM size; total local disk (for scratch, for out-of-core solutions, and for checkpointing); total archival disk (for storing results and subsequent analysis); total tape archive. And, almost never discussed, the count of people that fix and repair the hardware, the system engineers that keep the hardware/software running, the user support teams, and the software teams that write new software for these new machines, and the management teams that contrive to produce a stream of revenue to pay the bills and invest in new systems.
Explore posts in the same categories: Design, HPC

Leave a comment